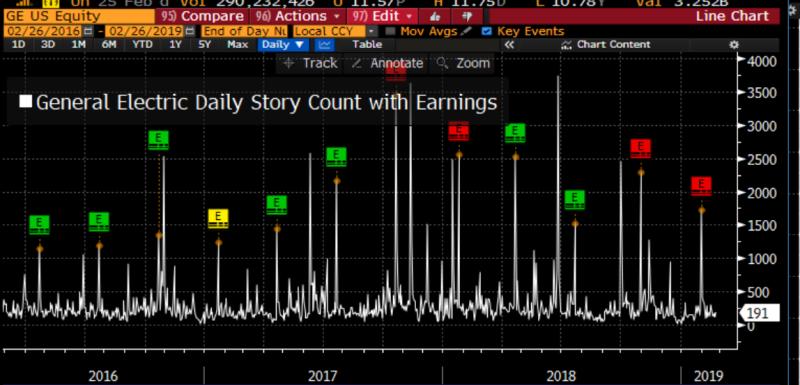
Layering events on Bloomberg charts can provide crucial insight. When I charted the daily number of news articles about GE there were mysterious spikes. WHY did news coverage jump so much those days? Adding icons showing the dates $GE reported earnings made it more clear.
$GE Reported Earnings