Breaking news has a familiar and predictable arc. There is a sudden spike and an equally and almost immediate decline.
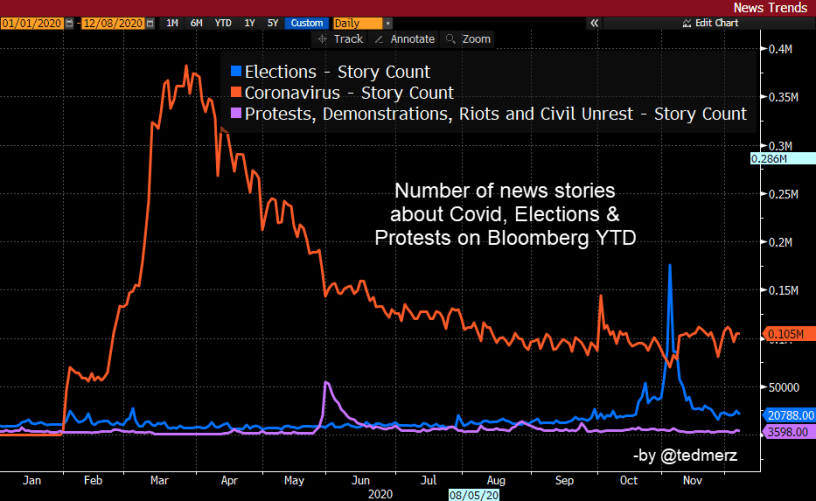
As the chart of data in the Bloomberg news archive shows, two of the three major news events in 2020 — the presidential elections and the Black Lives Matter protests — followed that well-worn pattern.
Covid-19 was the exception. The volume of news coverage globally was immense. Comparing it against those other two events shows the unusual magnitude and extraordinary duration of the coronavirus story.
A few other takeaways:
–News analytics can measure engagement. The high water mark for news coverage occurred on March 26th, three days after the low in the S&P 500 and well before it was clear that we’d turned a corner.
–Media coverage is a zero-sum game. There was a decline in coverage in early February as the national media focused on the impeachment hearings and presidential primaries.
-Coverage declined steadily until the U.S. presidential election in November and then picked up again in conjunction with higher infection rates.
–The level of covid coverage is unprecedented: At the high point, one in four stories carried on Bloomberg was about the pandemic, an unprecedented level of concentration.
-Covid-19 continues to dwarf every other news event, garnering about 100,000 articles a day. Brexit is generating 5,000 articles a day. Trump gets about 20,000.
The data I’m analyzing draws on a new archive of news articles on Bloomberg that includes an average of about 1.4 million stories a day from 175,000 sources in 40 languages. The scale of the chart is in millions.
DM me if you want to learn more about how to use the news archive to measure engagement on trending news topics.
